Bali Villa Rental Yields 2026: Where a Villa Pays for Itself in 9 Years
24 July 2026 · Bali Villa Hunter
What Does a Bali Villa Actually Earn?
Every Bali investment pitch quotes a yield. Almost none of them tell you where the number comes from. So we did something nobody selling you a villa will do: we took our two datasets — long-term rental listings and villa sale listings — and divided one by the other, area by area, for the same product: the 2-bedroom villa.
As always, our coverage is anchored in Sanur, our home market, where we track close to every active listing; the rest of the island flows in through the same channels and gives us the context to compare. The result is a first-of-its-kind map of what Bali’s rental market actually pays relative to what its sale market asks. If you’re an investor, this is your yield table. If you’re a renter — especially in Sanur — read it upside down: it shows exactly where your landlord is winning, and where you are.
- 2,128 unique 2-bedroom rental listings analyzed
- 827 unique 2-bedroom freehold sale listings
- March – July 2026 data range
- 100% real data
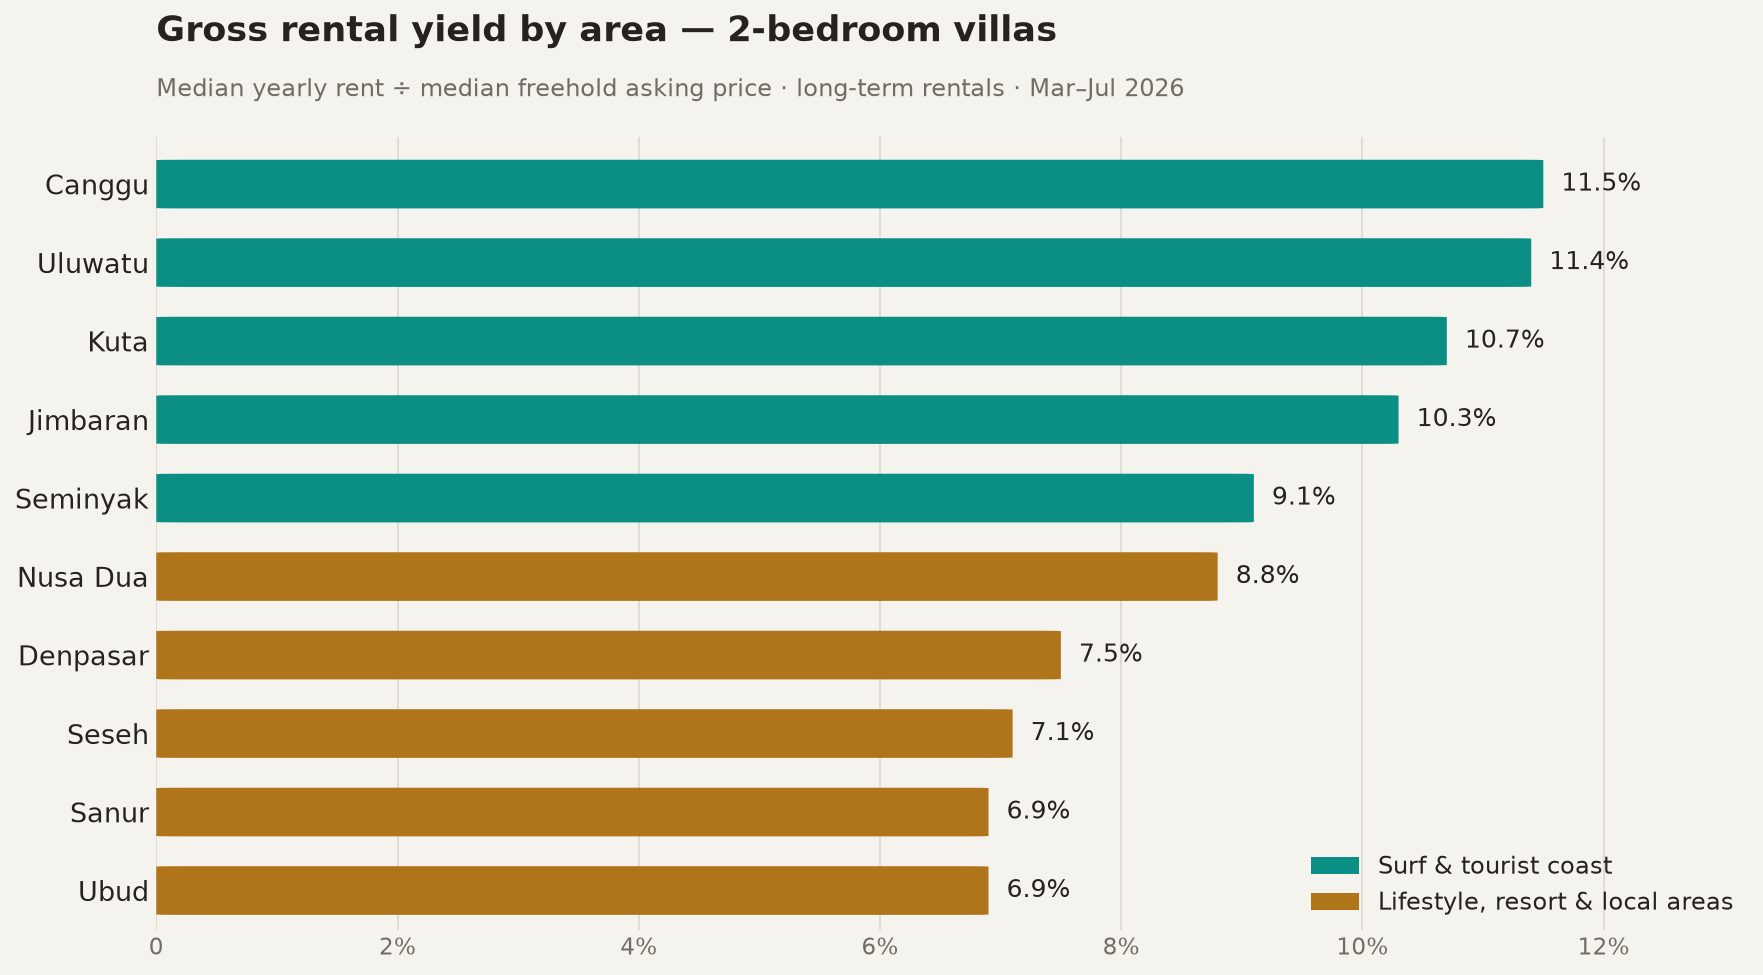
Bali Villa Gross Rental Yield by Area
Median yearly rent divided by median freehold asking price, 2-bedroom villas, deduplicated peer-to-peer listings:
| Area | Yearly rent (median) | Freehold price (median) | Gross yield | Payback |
|---|---|---|---|---|
| Canggu | 288M | 2.50B | 11.5% | 8.7 yrs |
| Uluwatu | 250M | 2.20B | 11.4% | 8.8 yrs |
| Kuta ⚠️ | 165M | 1.55B | 10.7% | 9.4 yrs |
| Jimbaran | 200M | 1.95B | 10.3% | 9.8 yrs |
| Seminyak | 245M | 2.70B | 9.1% | 11.0 yrs |
| Nusa Dua | 140M | 1.60B | 8.8% | 11.4 yrs |
| Denpasar | 90M | 1.20B | 7.5% | 13.3 yrs |
| Seseh ⚠️ | 280M | 3.95B | 7.1% | 14.1 yrs |
| Sanur | 225M | 3.25B | 6.9% | 14.4 yrs |
| Ubud | 250M | 3.60B | 6.9% | 14.4 yrs |
ℹ️ We collect public peer-to-peer listings from Bali’s most active property channels daily, deduplicate them with our own matching system (the same villa posted by five agents counts once), and filter out commercial guesthouses, land-only plots and listings with unreliable prices. Our collection is deepest in Sanur and the surrounding southeast; other areas are tracked for island context and can skew toward the premium end. Both sides of the ratio are asking prices, not closed transactions. ⚠️ marks areas where one side of the ratio has fewer than 25 unique listings.
Key Market Insights
The Island Splits in Two. The surf and tourist coast — Canggu, Uluwatu, Kuta, Jimbaran — yields 10–11.5% gross. The lifestyle markets — Sanur, Ubud, Seseh — yield about 7%. Same island, same villa type, a 4-point gap.
Sanur Is a Renter’s Market. In our home market, a villa asks 14.4 years of its own rent — the thinnest rental return on asset value we measured. Owners there price scarcity, not income. The flip side: renting in Sanur is the relative bargain of the island.
Canggu Pays Back in 8.7 Years. The median 2BR freehold ask (2.5B IDR) equals just 8.7 years of the median yearly rent (288M). The fastest paper payback on the island.
The 17% Mirage. Divide the island-wide median rent (240M) by the island-wide median price (1.4B) and you get a spectacular 17% “Bali yield.” It’s a statistical illusion — cheap Denpasar homes dominate the sale data while expat areas dominate rentals. No single area actually yields 17%.
ℹ️ Insights calculated from 4 months of consolidated 2-bedroom listings across both our rental and sale datasets.
Executive Summary
Put the two halves of our database side by side and Bali stops being one market. It becomes two.
On the surf and tourist coast, rents are enormous relative to what villas cost. A Canggu 2-bedroom asks 288M IDR a year in rent against a 2.5B freehold median — a gross yield of 11.5% from boring long-term tenancy, before anyone mentions nightly rates. Uluwatu matches it at 11.4%. These are markets where rental demand — remote workers, surf season, one-year contracts — has outrun the supply of finished villas.
In the lifestyle markets, the ratio flips — and our home market of Sanur is the cleanest example, because it’s where our data runs deepest (518 unique 2BR rentals). Sanur villas ask a 3.25B median while renting for 225M — a 6.9% yield, half the return per rupiah of asset. Prices there aren’t set by rental income at all; they’re set by land scarcity, retirees buying a decade of quiet, and owners who don’t need to sell. Ubud behaves the same way.
“Canggu prices villas like income machines. Sanur prices them like heirlooms. The yield table is just that sentence, in numbers.”
For a deeper look at what those asking prices mean by tenure, see our leasehold vs freehold report — and remember both sides of today’s ratio are asking prices. Sellers negotiate down more than landlords do, which means real-world yields tilt slightly above this table for a disciplined buyer.
The Renter’s Lens: How Many Years of Rent Is Your Villa Worth?
Flip the yield upside down and you get the payback column — the number of years of rent that equals the villa’s asking price. It answers a question every long-term renter eventually asks: is my rent absurd, or is the villa?
In Sanur, the math defends renting. Your landlord waits 14.4 years of rent to recover the asking price. You’re occupying a 3.25B asset for 225M a year — 6.9% of its value — while someone else carries the capital risk, the maintenance and the certificate questions. Renters rarely get to feel smug in Bali; this column is their moment, and it’s one reason Sanur long-term rentals move fast when priced right.
In Canggu, your rent is doing the heavy lifting. Every 8.7 years, tenants hand landlords the villa’s full asking value. If you plan to stay five-plus years, that is the strongest argument on the island for buying instead — it’s the same market where a leasehold year already costs half a rent-year.
Deep Dive into the Numbers
The bigger the sample, the more reliable the median. Sanur (518 rentals) and Canggu (629 rentals, 63 sales) are the strongest datasets; treat Kuta (22 rentals) and Seseh (17 sales, mostly premium new builds) as signals, not verdicts.
Why does the surf coast yield 4 points more than Sanur and Ubud?
Because the two markets price different things. Canggu, Uluwatu and Kuta prices are underwritten by rental demand — a constant inflow of one-year tenants keeps rents high relative to asset prices, and much of the sale inventory is newer build-to-rent product on smaller plots. Sanur, Ubud and Seseh prices are underwritten by scarcity: established gardens, beachfront walkability, large plots that no longer exist elsewhere, and owners in no hurry. Rent can’t keep up with what buyers will pay for the location itself, so the yield compresses. Neither number is “wrong” — they’re answers to different questions.
Where does the island-wide 17% figure come from — and why is it wrong?
Naive division. The island-wide median 2BR rent is 240M and the island-wide median 2BR freehold price is 1.4B, which “yields” 17%. But the two medians describe different places: the sale market’s center of gravity in our data is the local Denpasar belt (189 unique listings, 1.2B median), while the rental market’s center of gravity is Canggu and Sanur. Divide a Canggu-flavored rent by a Denpasar-flavored price and you manufacture a yield no actual villa delivers. Any pitch deck quoting an island-wide Bali yield is making exactly this error — always ask which area, which product.
From gross to net: what does 11.5% become in practice?
Take the Canggu median: 288M rent on a 2.5B villa. Now subtract reality. Annual maintenance and repairs in a tropical climate (pool, garden, roof, AC) typically run 1–2% of asset value (~25–50M). Add land and building tax, insurance, an agent’s fee on new tenancies, and an occasional vacant month between contracts. A well-run long-term rental keeps 70–80% of gross — landing net yield around 8–9% in Canggu and 5–5.5% in Sanur. Still strong by global standards, but the gap between areas survives every deduction.
Can a foreigner even capture these yields?
Not through freehold — that title (Hak Milik) is reserved for Indonesian citizens, which is why we use it as the clean market benchmark rather than a shopping list. Foreigners hold villas through a long lease or a PT PMA company with a right-to-build title. That changes the yield math fundamentally: a 25-year leasehold asset amortizes to zero, so part of every rent payment is return of capital, not return on it. Our leasehold vs freehold report covers what that tenure actually costs.
Practical Insights
Investors: buy where tenants are, not where brochures are. The data is unambiguous — long-term rental demand concentrates its rewards in Canggu and Uluwatu at 10–11.5% gross. A Sanur, Seseh or Ubud villa can still be a fine purchase, but as a scarcity asset, not an income machine; at ~7% gross you are betting on appreciation, and the rent won’t bail out an overpay.
Renters: use the payback column in negotiations. In Sanur, your landlord’s asset earns 6.9% gross at asking — there is structurally more room to move than with a Canggu landlord clearing 11.5%, and our data shows most Sanur landlords do negotiate. In Canggu, expect the opposite: yields this strong keep attracting new landlords, and rent discounts stay thin.
Nobody earns the asking-price yield. Both the numerator and the denominator of this table are negotiable. Buyers who push the price down 10% turn Canggu’s 11.5% into 12.8%; renters who push rent down 10% turn Sanur’s payback into 16 years. The table is the starting grid, not the finish line.
Check the sample before you trust the median. Kuta’s 10.7% rests on 22 rental listings; Seseh’s 3.95B freehold median on 17 sales skewed to premium new builds. The Sanur and Canggu medians are the ones we’d defend in an argument — Sanur because it’s our home market and our coverage there is close to complete.
Conclusion: Two Islands, One Spreadsheet
Bali’s rental and sale markets are usually analyzed in separate tabs. Put them in one and the island’s real structure appears: a surf coast priced for income, a lifestyle belt priced for scarcity, and a 4-point yield gap between them that no marketing deck mentions — because most decks quote the 17% mirage instead.
The numbers give you the map. The deal itself — whether that 11.5% villa has a clean certificate, honest build quality and a price worth paying — is decided on the ground, not in a spreadsheet. That part is what we do: a local team in Bali that inspects the villa, checks the owner and negotiates before your money moves. The yield only exists if the villa is real.