Bali Rental Market Snapshot: August 2026
7 September 2026 · Bali Villa Hunter
August 2026 Rental Market Snapshot
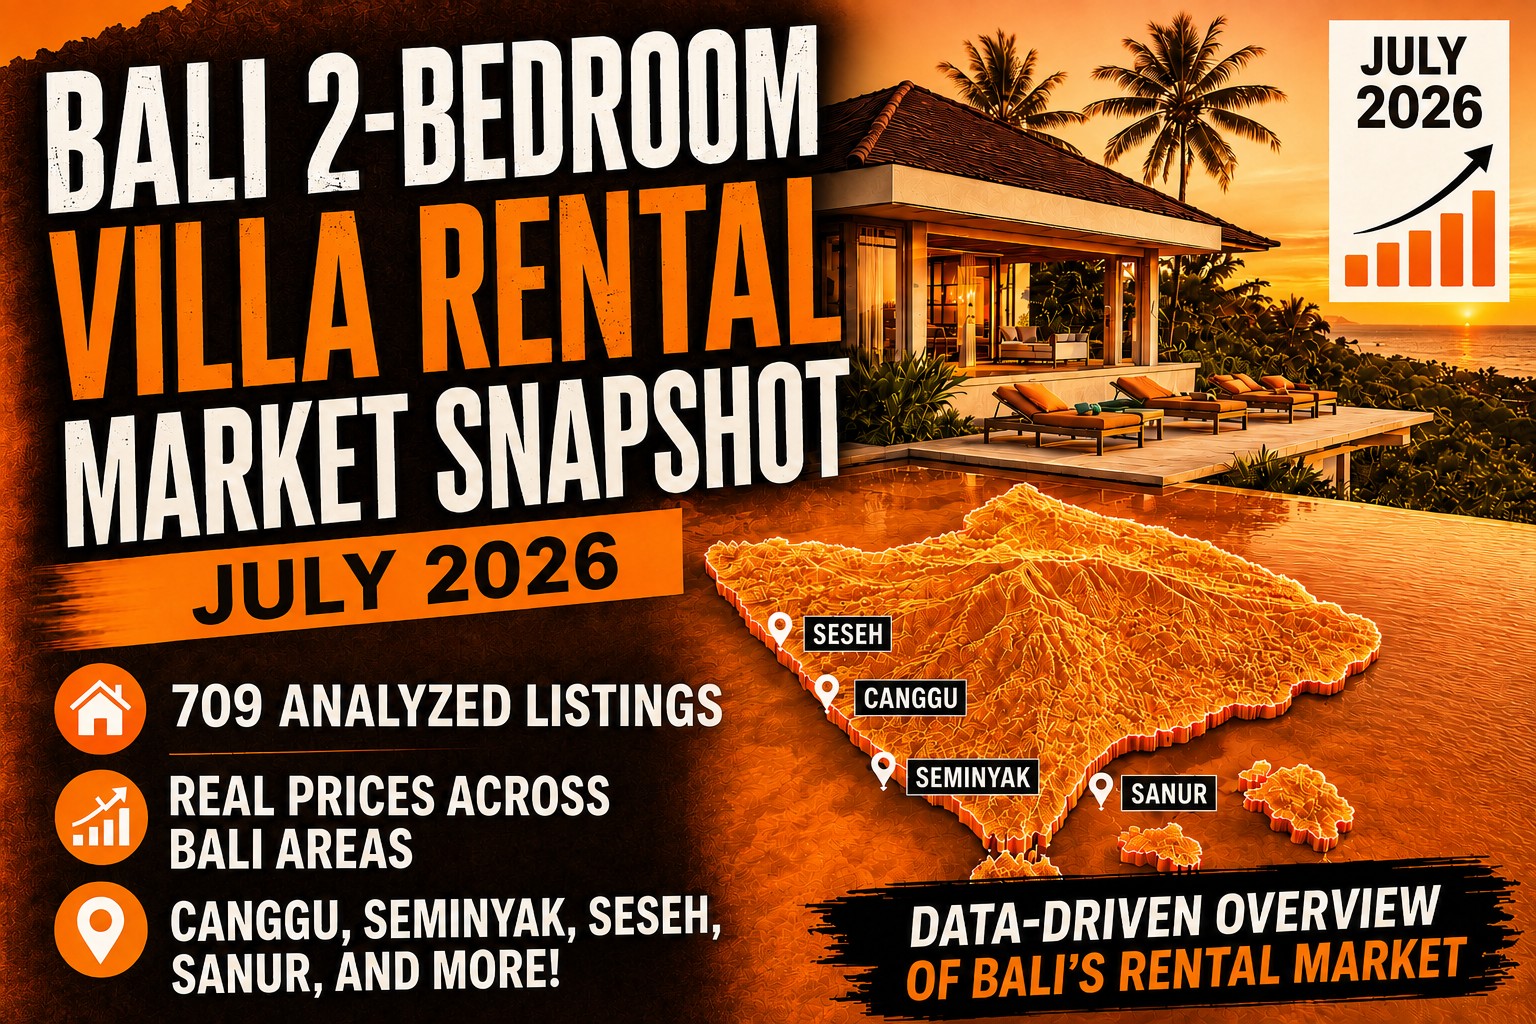
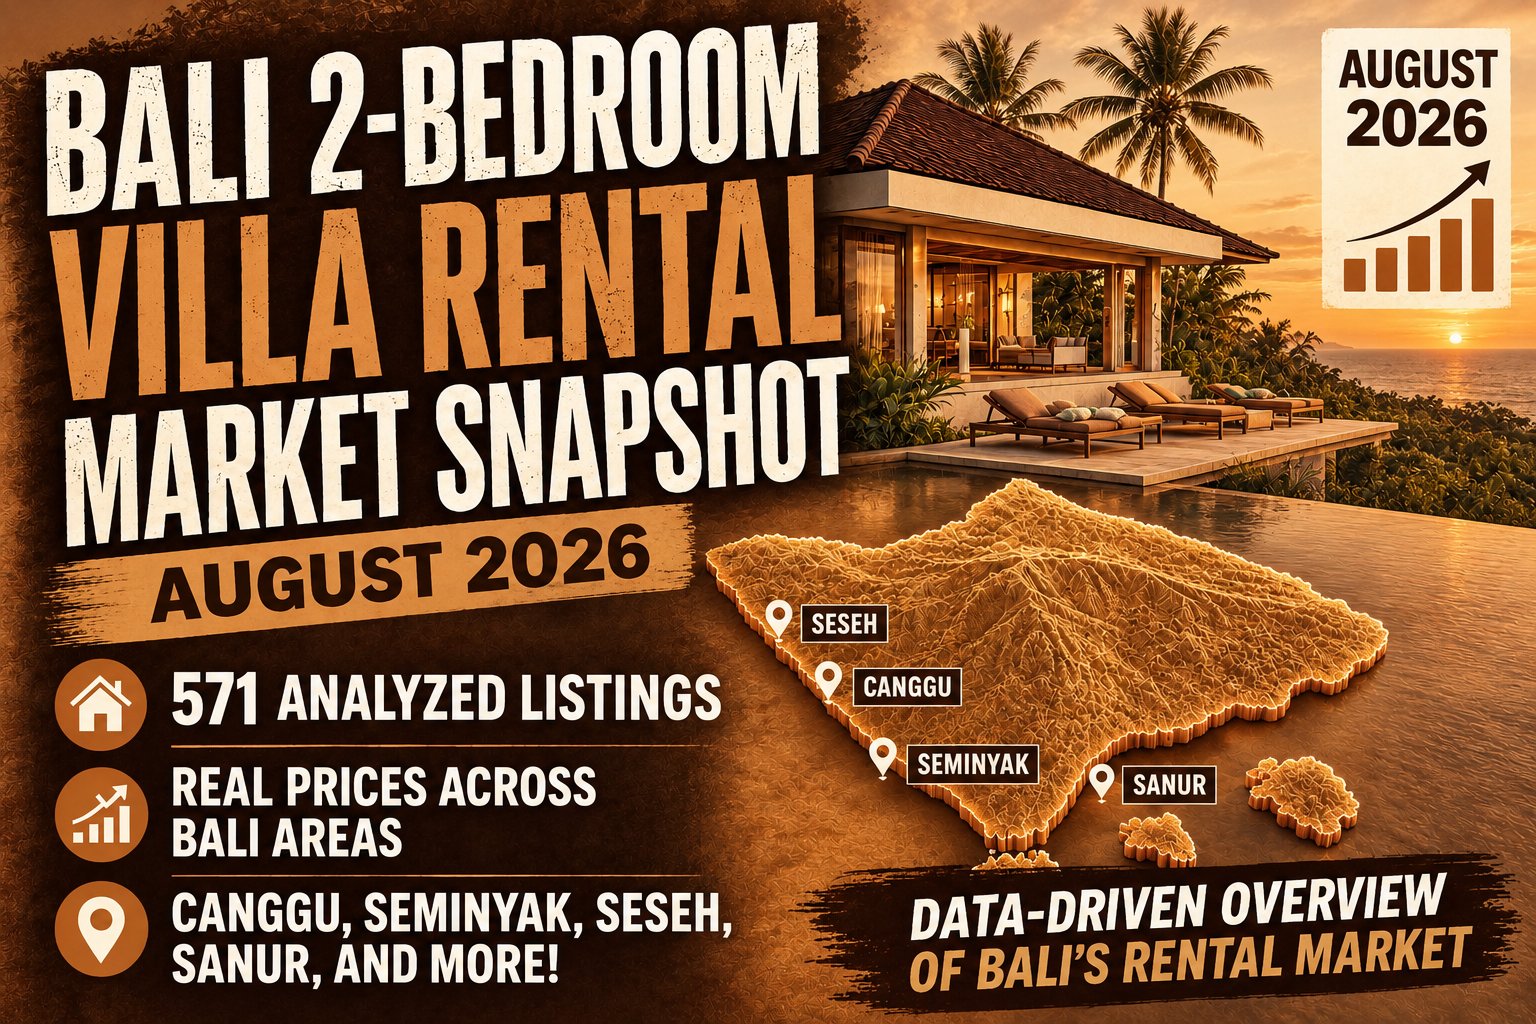
Real-world rental data from 571 cleaned 2-bedroom villa listings in Bali. We filter out the spam and duplicates to show you the hard numbers on pools, pricing, and market direction.
- 571 listings across Bali
- August 2026 data range
- 11 areas analyzed
- 100% real data
Bali 2 Bedroom Villa Rental Prices by Area
| Area | Listings | With pool | Annual lease (pool) | ÷12 per month (pool) | ÷12 per month (no pool) |
|---|---|---|---|---|---|
| Uluwatu | 10 | 10 | ⚠️ 365M | ⚠️ 33.3M | — |
| Seseh | 17 | 17 | 300M | 28.0M | — |
| Canggu | 84 | 78 | 295M | 26.8M | ⚠️ 17.2M |
| Sanur | 244 | 201 | 250M | 20.8M | 10.8M |
| Ubud | 23 | 15 | 240M | 20.8M | ⚠️ 13.0M |
| Denpasar | 54 | 10 | ⚠️ 230M | ⚠️ 19.4M | 6.2M |
| Seminyak | 48 | 45 | 200M | 18.0M | ⚠️ 6.2M |
| Nusa Dua | 6 | 2 | ⚠️ 185M | ⚠️ 15.4M | ⚠️ 8.5M |
| Jimbaran | 10 | 8 | ⚠️ 140M | ⚠️ 12.0M | ⚠️ 12.5M |
ℹ️ How to read the price columns. About two-thirds of Bali rental listings quote a price for the year, not the month — an annual lease is the island’s default long-term product. The per-month columns are that annual ask divided by twelve, which is what a year’s tenancy costs you monthly. It is not a month-to-month rate: renting by the month costs substantially more, and this month more than ever (see below). Each column is a median in its own right, so the annual and per-month figures on a row are close to, but not exactly, twelve times apart. Only areas with 5 or more active listings are included, ⚠️ marks a figure resting on 10 or fewer listings, and — means the area had no listings of that type at all.
Key Market Insights
Most Expensive Market — Uluwatu. 365M IDR a year, on ten listings spread from 180M to 840M. A ceiling, not a market price.
Most Stable Expat Hub — Sanur. 250M IDR a year for the third month running, with the middle half of its pool stock between 200M and 275M.
The Month’s Real Story — Canggu Split In Two. A year’s lease fell to 180M IDR (15.0M a month) while month-to-month asks rose to 31.0M — the same area, at double the price, depending on the contract.
Biggest No-Pool Savings — Sanur. 130M IDR a year against 250M with a pool — a 48% saving, unchanged from July, and still the deepest budget stock outside Denpasar.
ℹ️ Market insights derived from cleaned August 2026 rental listings tracked by Bali Villa Hunter across Bali’s major 2BR villa markets.
Executive Summary
As on-the-ground specialists in Sanur, we prioritize our data collection efforts here, resulting in the most robust and complete dataset for the area (244 listings analyzed this month). To provide our clients with a complete picture of the island, we track secondary benchmark markets like Canggu, Seseh, and Uluwatu to show where Sanur stands in the broader Bali landscape.
For a third month, the headline did not move: the island-wide median annual lease for a 2-bedroom pool villa stayed at 250M IDR, and Sanur stayed at exactly that figure for a third month too.
Underneath that flat headline, August did something July did not — the market pulled apart into two different products at two different prices. Compared like for like on annual leases only, the island-wide median eased again, from 240M in July to 230M, continuing a slow drift that started at 250M in June. Month-to-month asks went the other way, from 25.0M IDR a month to 30.0M. In July the flexibility premium was about 9%; in August it is about 30%.
“The island’s price didn’t change. What changed is that a year in a villa and a month in the same villa are no longer priced anything alike.”
Some of that is the calendar — August is high season, and the villas offered by the month are disproportionately holiday-grade — but the split is too large to be seasonal alone, and it is concentrated in exactly the areas where the annual-lease market is shrinking.
A note on this month’s sample. August’s dataset is smaller than July’s, 571 listings against 709. That is a change on our collection side, not a contraction in Bali’s supply: one of our data channels was interrupted for most of the month while the others ran normally, and the affected channel is concentrated in Sanur. It does not move the numbers — Sanur’s median is 250M in July and 250M in August, and the middle half of its pool stock sits in the same band in both months.
Market Overview — Pool vs. No Pool
A private pool remains the default in Bali’s expat stock: 428 of 571 listings have one, or 75%. As in July, the western hubs are close to total — 78 of Canggu’s 84 listings and 45 of Seminyak’s 48 — and Seseh and Uluwatu recorded no pool-less 2-bedroom listings at all.
Island-wide the budget segment sits at a 95M IDR annual median, or 8.3M a month, against 250M with a pool. That per-month figure is identical to July’s; the annual median eased from 100M.
Only two areas have a budget tier deep enough to describe honestly. Sanur’s 43 no-pool listings give a 130M IDR annual median (10.8M a month) — exactly July’s figure, on a sample half the size. Denpasar’s 44 give 75M (6.2M a month), up from 65M in July and 70M in June. Everywhere else the no-pool column rests on two to eight listings and should be read as an anecdote: Canggu’s six range from 57M to 350M a year, which is not a market, it is a list.
The pool premium in Sanur is therefore about 120M IDR a year — roughly half your rent, unchanged from July. That is the number to negotiate against.
Detailed Area Analysis
The bigger the sample, the more reliable the median. Figures flagged with ⚠️ rest on 10 or fewer listings — treat those as a rough signal, not a firm conclusion. Month-over-month comparisons below are made like for like, on listings that quoted an annual price in both months.
🎯 The Primary Focus: Sanur
Sanur (244 listings, 201 with a pool): our primary market of expertise shows an annual lease median of 250M IDR — identical to June and July, on 166 annual quotes. The middle half of the pool stock sits between 200M and 275M a year (16.7M to 22.9M monthly), the same band as last month. Sanur is also the island’s most genuinely annual market: only 6% of its pool listings advertise a month-to-month rate, against 37% in Canggu.
Within Sanur the beachside strip commands 285M IDR a year across 54 pool listings, against 228M for the 96 on the west side — a premium of roughly 57M, or 25%. In July the same split read 275M against 235M, so the gap widened by about 40%. For long-term expat families the west side remains the value play: the same walking distance to hospitals and international schools, at three-quarters of the beachside ask.
🌊 Secondary West-Coast Benchmarks: Canggu & Seseh
Canggu (84 listings, 78 with a pool) is the month’s most important area, and its headline number is the most misleading on the table. It reads 295M IDR a year — up from July’s 264M — while the actual price of an annual lease fell for the third month running: 250M in June, 212M in July, 180M in August, a 28% decline over two months. The table figure rose because the mix of listings changed, not because anything got more expensive: 37% of Canggu’s pool listings now quote a month-to-month rate, against 24% in July, and those asks climbed from 26.5M to 31.0M a month. A year’s lease in Canggu now costs about 15.0M a month; the same villa by the month costs about 31.0M.
Seseh (17 listings, all with a pool): 300M IDR on the table, and 280M like for like against 250M in July — up about 12%, but on ten annual quotes, in an area whose seventeen listings run from 200M to 786M. Seseh remains a two-tier market rather than a single price.
⛰️ Secondary Southern Benchmark: Uluwatu
Uluwatu (10 listings, all with a pool): nominally the island’s ceiling at 365M IDR a year. As in July, the median is the least useful number here — the ten listings run 180M, 264M, 300M, 336M, 350M, 380M, 450M, 450M, 456M and 840M, so the “median” is simply the midpoint of a very wide, very thin spread. Only three quoted annually, which is too few for any month-over-month comparison. Uluwatu tells you what the top of the island costs, not what Uluwatu costs.
🌴 Secondary Alternatives: Seminyak, Ubud & Jimbaran
Seminyak (48 listings, 45 with a pool): 200M IDR a year in the table and 192M like for like, against 200M in July — down about 4%, the same gentle drift as the island as a whole. Its budget tier has effectively vanished: three of 48 listings have no pool. Ubud (23 listings, 15 with a pool): 240M IDR, but Ubud remains the island’s most month-to-month market — 60% of its pool listings quote monthly and only two quoted a year, so there is no honest comparison to make with July. Jimbaran (10 listings, 8 with a pool): 140M IDR ⚠️, down from 220M in July, but on eight pool listings running 90M to 308M. Read that as a thin month, not a crash.
⚠️ Low-Volume Warnings & Budget Extremes
Denpasar (54 listings) is where the cheap stock actually lives: 44 of its listings have no pool, at a 75M IDR annual median (6.2M a month), and that budget tier has firmed up about 15% since July. Its pool tier is the opposite — ten listings, a 230M median, and individual asks running as high as 450M. The table figure looks like a jump from July’s 135M; on the five listings that quoted annually the median is 135M, exactly where it was. Ignore Denpasar’s pool column and use its no-pool column, which is one of the two most reliable budget numbers on the island. Nusa Dua (6 listings) remains too small for planning in either direction.
Practical Insights
The cost of flexibility roughly tripled this month. In July, month-to-month asks annualised to 261M IDR against 240M for annual leases — a 9% premium. In August it is 300M against 230M, a 30% premium, and per area the gaps are wider still: in Canggu 31.0M IDR a month against 15.0M on an annual lease, in Seseh 39.0M against 23.3M, in Sanur 32.5M against 20.0M, in Seminyak 20.0M against 16.0M. Two caveats before you act on it: August is peak season, and the villas offered by the month skew to holiday-grade stock, so you are not always comparing the same house. But the direction is unambiguous, and if you are staying a year, signing for the year has never paid better.
Canggu’s advertised price and Canggu’s actual price have separated. This is the single most actionable thing in this month’s data. The number you will see quoted for Canggu — ours included, at 295M IDR — is now pulled upward by short-stay stock that has nothing to do with a long-term tenancy. The real annual lease has fallen to 180M, or about 15.0M a month, which is below Sanur’s 20.8M. If you want a year in Canggu, do not accept the headline: ask specifically for the annual rate, and know that the market has moved 28% in your favour since June. If you want three months in Canggu, expect to pay roughly double that per month.
Sanur’s beachside premium is widening, and the west side is where the value sits. Beachside Sanur now asks 285M IDR a year against 228M on the west side — 57M, or a quarter more, up from a 40M gap in July. Both halves are stable in absolute terms; what changed is the distance between them. For a two-bedroom family rental where the daily routine is school, hospital and supermarket rather than the beach path, the west side buys the same location logic for three-quarters of the money.
If your budget is under 10M IDR a month, there are two honest answers on this island. Denpasar without a pool, at 75M a year (6.2M a month) across 44 listings, and Sanur without a pool, at 130M a year (10.8M a month) across 43. Everywhere else, the budget product either does not exist in 2-bedroom form or exists in numbers too small to shop from. Canggu and Seminyak in particular offer no downgrade path: 93% and 94% of their listings include a pool, so you cannot trade the water for a lower rent there.
Conclusion
The Bali rental market continues to show distinct regional patterns, but navigating it successfully requires understanding where your data comes from. Because Sanur is our primary focus and specialty, we prioritize our data collection efforts heavily on this area. This targeted methodology ensures our Sanur dataset (244 listings this month) is the most robust and complete on the island, giving you a reliable baseline of the local expat market.
August’s lesson is that a flat headline can hide a market splitting in two. The island’s median has not moved since June, and Sanur’s has not moved at all — but the annual lease has drifted down for a third month while the month-to-month rate has jumped, and in Canggu the two are now a factor of two apart in the same streets. The right question is no longer “what does a villa cost here”, it is “what does a villa cost here on my contract”.
Our goal is to provide you with this transparent baseline every month — especially in our home market of Sanur — so you can negotiate with confidence and know exactly what your money should buy.
Note on month-over-month figures: July comparisons are recalculated on our current dataset and, where stated as like-for-like, restricted to listings that quoted an annual price in both months. They can therefore differ from the figures published in July’s snapshot.
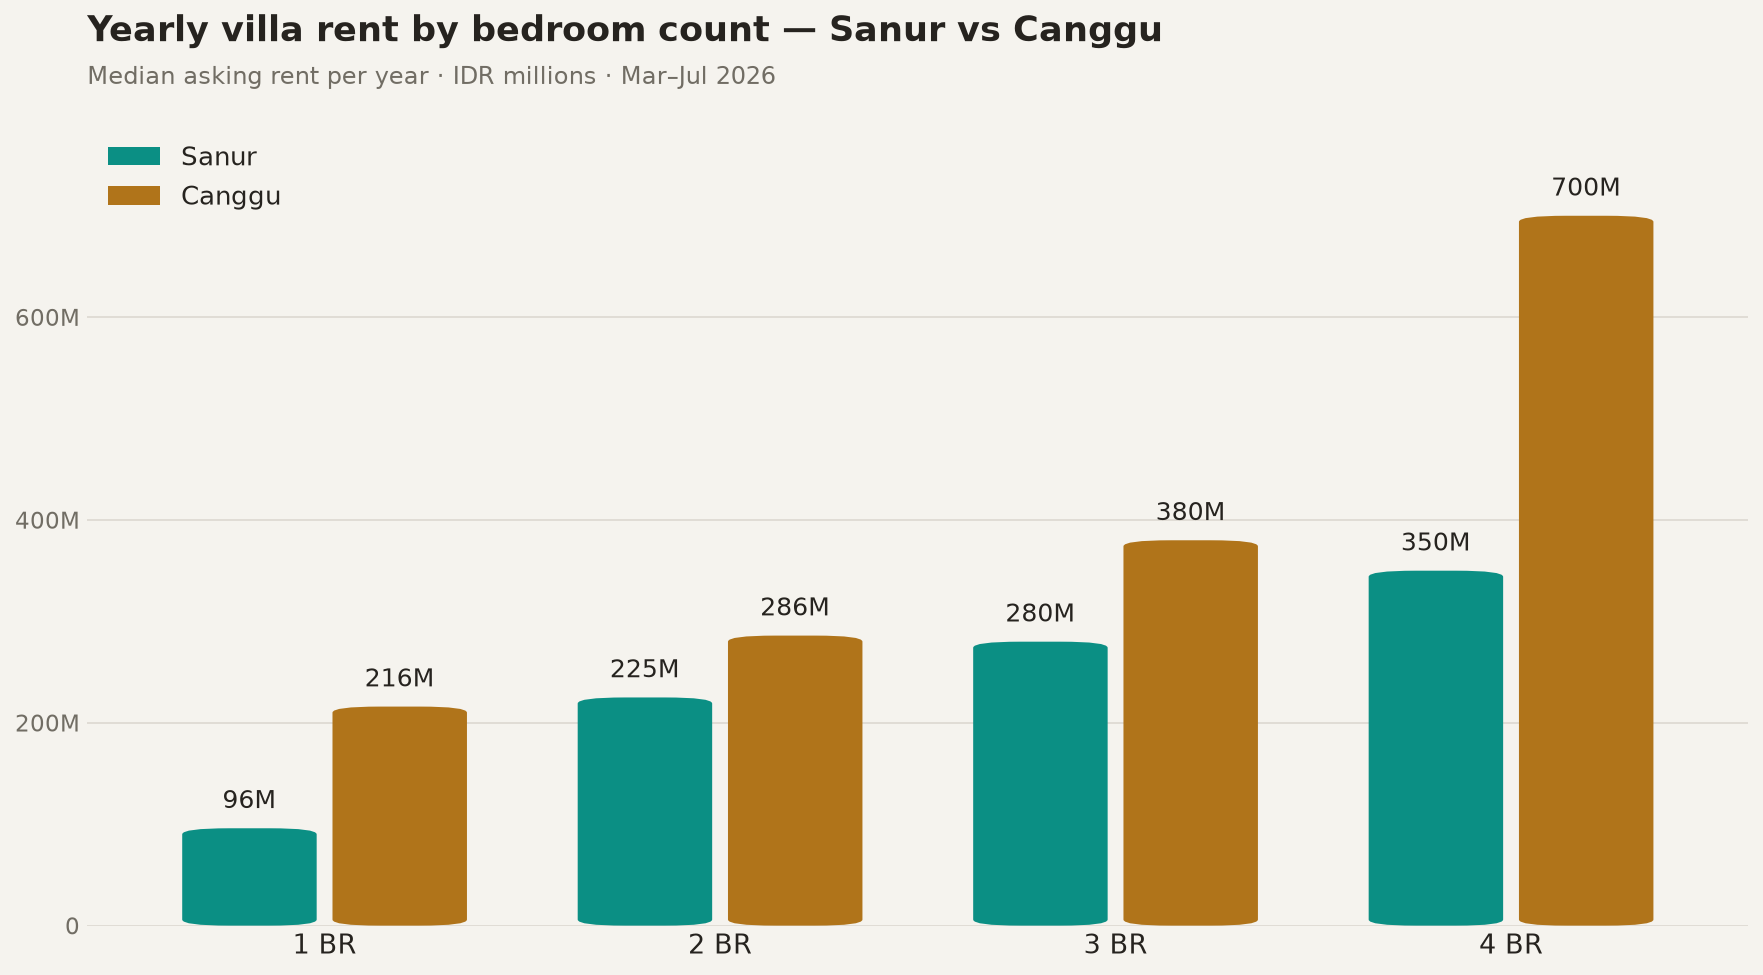
See also our related analysis: Bali Rental Market Snapshot: July 2026, Bali 2-Bedroom Villa Price Distribution: Where is the Sweet Spot? and Bali Villa Rents by Bedroom Count 2026