Bali Rental Market Snapshot: October 2026
2 November 2026 · Bali Villa Hunter
October 2026 Rental Market Snapshot
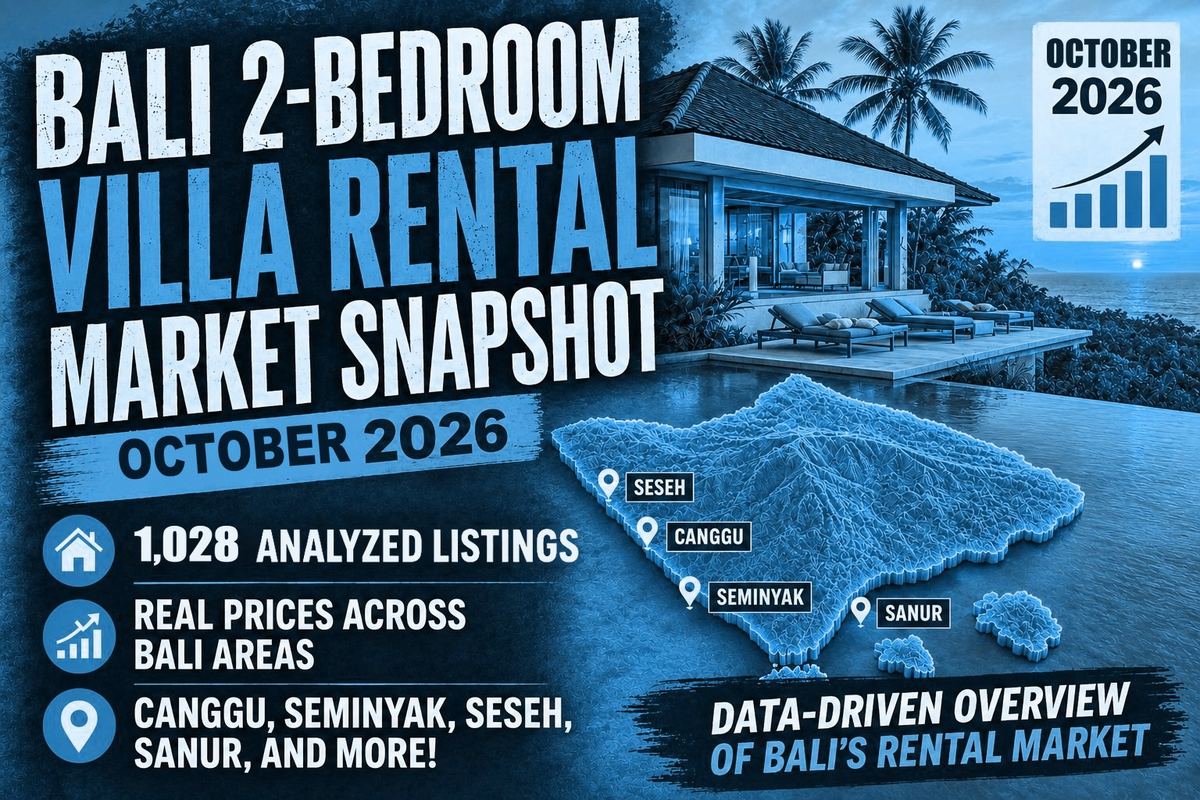
Real-world rental data from 1,028 cleaned 2-bedroom villa listings in Bali. We filter out the spam and exact reposts to show you the hard numbers on pools, pricing, and market direction.
- 1,028 listings across Bali
- October 2026 data range
- 11 areas analyzed
- 100% real data
⚠️ This month’s table cannot be compared with earlier months. We saw 1,028 listings against 211 in September, but the market did not grow fivefold. For most of October we focused our data collection on the west coast to serve active client searches, and widened it there to include listings that had been on the market since before October. As a result, 87% of the sample now sits in the Umalas, Kerobokan, Seminyak, Seseh and Canggu corridor. Sanur, our home market, fell from 111 listings to 28, and 26 of those arrived in the last eleven days of the month. Read this report as a deep look at the west coast, not as a month-on-month price move.
Bali 2 Bedroom Villa Rental Prices by Area
| Area | Listings | With pool | Year lease only (pool) | All asks, per year (pool) | All asks, per month (pool) | All asks, per month (no pool) |
|---|---|---|---|---|---|---|
| Canggu | 171 | 154 | 275M | 360M | 32.0M | 12.5M |
| Uluwatu | 35 | 29 | ⚠️ 275M | 360M | 31.0M | ⚠️ 10.8M |
| Seseh | 187 | 176 | 285M | 330M | 28.0M | 17.5M |
| Ubud | 9 | 8 | — | ⚠️ 298M | ⚠️ 27.5M | ⚠️ 25.0M |
| Umalas & Kerobokan | 521 | 421 | 230M | 250M | 20.8M | 10.4M |
| Seminyak | 12 | 8 | ⚠️ 240M | ⚠️ 235M | ⚠️ 20.8M | ⚠️ 10.1M |
| Sanur | 28 | 24 | 230M | 215M | 20.8M | ⚠️ 10.5M |
ℹ️ How to read the price columns. About two-thirds of Bali rental listings quote a price for the year, and about three in ten quote by the month. Year lease only uses just the listings quoted annually, so it is the column to negotiate a 12-month contract from. The all asks columns put both kinds of listing on one basis, so an area with many month-to-month listings reads high: Canggu’s 360M is not what a year lease costs there. Each column is a median in its own right, so figures on a row will not divide neatly by twelve. Only areas with 5 or more listings are included, ⚠️ marks a figure resting on 10 or fewer listings, and — means the area had no listings of that type. Earlier snapshots folded Umalas and Kerobokan into Seminyak; this month they are shown separately because they make up almost all of that group.
Key Market Insights
The Month’s Real Finding — Canggu’s Year Lease Is About 275M. On 45 annual quotes, with the middle half between 220M and 305M. The 170M we published in September rested on seven.
New This Month — Umalas vs. Kerobokan. Neighbouring areas, different prices: about 255–260M IDR a year in Umalas against about 205–220M in Kerobokan.
Most Expensive Year Lease — Seseh. 285M IDR on 96 annual quotes, in line with August’s 280M on ten times the sample.
Flexibility Costs More Than We Said. Month-to-month asks run about 40% above a year lease in Kerobokan, 50% in Canggu and 60–70% in Seseh, not the 30% we measured last month.
ℹ️ Market insights derived from cleaned October 2026 rental listings tracked by Bali Villa Hunter across Bali’s major 2BR villa markets.
Executive Summary
Sanur is our home market and, in a normal month, by far our deepest dataset. October was not a normal month. We moved most of our data collection to the west coast, and Sanur only came back into the sample in the final days of the month. So this report does something different: it says little about Sanur, and more about the west coast than any snapshot we have published.
The first conclusion is what we cannot tell you. The island-wide year-lease median reads 250M IDR against 230M in September, and it would be easy to call that a 9% rise. It is not a rise we can support. The sample moved towards dearer areas, so the higher figure mostly records where we looked.
The second is a correction. For months we have reported a slide in Canggu’s year lease: 250M, 212M, 180M, 170M. October’s 45 annual quotes put it at 275M, with the middle half between 220M and 305M. Rents did not jump 60% in a month. The earlier readings most likely leaned towards the cheaper end of Canggu, and September’s rested on just seven listings. We would stop using them.
The third is new information. With 354 year-lease quotes, we can now price Umalas and Kerobokan separately for the first time, and they are not the same market. Seseh, meanwhile, simply held: the 280M we reported on ten quotes in August is 285M on 96.
“Five times the listings did not show a market moving. It showed us what we had been missing on the west coast.”
Market Overview — Pool vs. No Pool
A private pool is the default in this month’s sample: 869 of 1,028 listings have one, or 85%, against 79% in September. That rise is another sampling effect. The west coast is villa country, and our sample now leans heavily on it.
Island-wide, the no-pool median reads 130M IDR a year (10.8M a month) on 159 listings, against 80M in September. The budget areas barely appear this month, so this does not mean no-pool rents rose.
The useful number is Kerobokan. Umalas and Kerobokan together hold 100 of the 159 no-pool listings, at a median of 125M IDR a year (10.4M a month), with the middle half between 105M and 172M. Most are houses rather than villas: 71 of the 100. On year-lease quotes Kerobokan reads 120M against about 205–220M with a pool, so a private pool adds roughly 70–80%. That makes it the deepest no-pool reading we have for the west coast.
Detailed Area Analysis
The bigger the sample, the more reliable the median. Figures flagged with ⚠️ rest on 10 or fewer listings, so treat those as a rough signal. Comparisons with earlier months below use listings that quoted an annual price in both months, but this month’s mix of listings is different, so even those need care.
🎯 Our Home Market: Sanur
Sanur (28 listings, 24 with a pool): the year-lease median is 230M IDR on 17 annual quotes, the same as September, with the middle half between 185M and 285M. Eight of the 17 sit at or below 200M. That is about a quarter of September’s roughly 70 quotes, so we cannot call the market steady on this evidence.
We also need to qualify what we told you last month. We reported Sanur stepping down from 250M to 230M. Counting each property once rather than each listing, September still reads 250M, so that step down was less firm than we said. The same count gives 215M for October, on 16 properties. Until the sample recovers, the honest range for a Sanur year lease is 215M to 250M.
The rest is too thin to use: beachside ⚠️ 350M on six pool listings, west side ⚠️ 200M on nine, and five month-to-month quotes at 24.0M a month against 19.2M on a year lease. The four no-pool listings run from 57M to 160M; August’s 130M remains the better anchor.
🌊 West-Coast Benchmarks: Canggu & Seseh
Canggu (171 listings, 154 with a pool): the headline reads 360M IDR, but 84 of the 154 pool listings quote by the month, at a median of 35.0M. The 45 annual quotes give 275M, or 22.9M a month, and counting each property once gives the same figure. On all asks, Pererenan reads 355M, Berawa 342M and Padonan 324M; all three include month-to-month stock.
Seseh (187 listings, 176 with a pool): 285M IDR on 96 annual quotes (275M counting each property once), with the middle half between 250M and 312M. August read 280M on ten quotes and September 268M on four, so the thin readings were about right. Cemagi reads 285M and Seseh itself 275M on 48 quotes each, close enough to treat as one market. Month-to-month asks are 37–40M a month, and 35% of pool listings quote that way.
🏡 New This Month: Umalas & Kerobokan
Umalas and Kerobokan (521 listings, 421 with a pool): 230M IDR on 354 annual quotes, with the middle half between 180M and 275M. This is the largest single-area sample we have published outside Sanur.
The two do not price alike. Umalas reads 260M on 128 annual quotes (21.7M a month), with the middle half between 208M and 320M. Kerobokan reads 205M on 226 (17.5M a month), with the middle half between 165M and 250M.
Repeat listings are common here. A single group of near-identical listings accounts for about 90 of Kerobokan’s total, at prices from 130M to 420M. Counting each property once gives 255M for Umalas and 220M for Kerobokan, so we quote the pair as ranges: about 255–260M against about 205–220M. Kerobokan is cheaper on either count.
Month-to-month asks are 25.0M a month in Kerobokan on 47 quotes and 40.0M in Umalas on 15.
⛰️ Southern Benchmark: Uluwatu
Uluwatu (35 listings, 29 with a pool): 360M IDR on all asks, against 10 listings in August and 5 in September, and 25 of the 35 arrived in the last six days of the month. It is largely a month-to-month market: 20 of the 29 pool listings quote that way, at a median of 30.5M a month. Only five quote annually, at 190M, 275M and 400M, and three of those five are the same 275M villa, so the ⚠️ 275M in the table is not yet a real year-lease price. The middle half of all asks runs from 275M to 530M, which confirms Uluwatu’s place in the island’s premium tier.
🌴 Thin This Month: Seminyak & Ubud
With Umalas and Kerobokan shown separately, Seminyak itself has only 12 listings, 8 with a pool, at ⚠️ 235M IDR on all asks and ⚠️ 240M on four annual quotes. Earlier months’ Seminyak figures include Umalas and Kerobokan, so they do not compare directly with this row. Ubud (9 listings, 8 with a pool) reads ⚠️ 298M and had no annual quotes at all, which makes it the most purely month-to-month market in the table.
⚠️ Dropped This Month
Denpasar, Jimbaran and Nusa Dua each had 4 listings and Kuta had 2, all below our five-listing floor, so we have dropped them rather than show medians on a handful of properties. The most recent usable readings remain Denpasar’s 55M IDR no-pool median from September, and Jimbaran’s 140M and Nusa Dua’s 185M from August.
Practical Insights
If you are searching around Umalas, look at Kerobokan first. A 2-bedroom pool villa on a year lease has a median ask about 35M to 55M IDR a year lower there, or roughly 3M to 4.5M a month. The middle half of Kerobokan’s stock runs from 165M to 250M, so asks in the 200M range are mainstream rather than bargains. Above about 250M in Kerobokan, you should be able to say what you are paying extra for.
Stop using 170M as a Canggu number. Our last few snapshots pointed to Canggu year leases at about 14–15M a month. On a real sample the middle half is 220M to 305M, or roughly 18–25M a month, with a median of 22.9M. Our older advice still applies: never negotiate from the 360M headline, because month-to-month stock inflates it. Ask for the annual rate specifically.
Flexibility costs more than we told you. Last month we called a 30% month-to-month premium structural. Compared within each area, it looks too low for the west coast: about 40% in Kerobokan, 50% in Canggu, 60–70% in Seseh, and about 85% in Umalas on just 15 monthly quotes. Sanur reads about 25%, on only five, and September’s sample was mostly Sanur, which may be why we saw 30%. The island-wide comparison (396M against 250M) overstates the gap, because the annual side is heavy with Kerobokan and the monthly side with Canggu and Seseh. Some of the premium is product, too, as month-to-month stock skews towards holiday-grade villas. If you are staying a year, sign for the year.
If you are shopping at about 10M IDR a month, Kerobokan is this month’s answer. Its 79 no-pool year-lease quotes have a median of 120M a year (10.0M a month), with the middle half between about 96M and 150M. Expect a house rather than a villa. Denpasar was the cheaper option in September and probably still is, but with four listings we cannot price it this month.
In Sanur, 250M is still open to negotiation. Nothing in October suggests prices have firmed: eight of the 17 annual quotes sit at or below 200M. But 17 quotes cannot set a new benchmark, so treat 215M to 250M as the working range until our Sanur data recovers.
Conclusion
Sanur remains our home market, and we would rather tell you it is thin this month than present 28 listings as if they settled anything. Until our coverage there recovers, Sanur’s figures should be read with the same caution as any small sample.
October’s value lies elsewhere. Looking properly at the west coast corrected one number we had been publishing for months, Canggu’s year lease. It confirmed another, Seseh’s. And it gave us a first real price gap between two neighbouring areas that are usually discussed as one. None of that says the market moved in October. All of it should help you judge an asking price.
Our goal is to give you this transparent baseline every month, so you can negotiate with confidence and know what your money should buy. That includes telling you when the sample changed, and when something we told you last month did not hold up.
Note on month-over-month figures: earlier months are recalculated on our current dataset and, where stated as like-for-like, restricted to listings that quoted an annual price. They can therefore differ from the figures published in earlier snapshots. Figures count listings rather than properties unless stated; the same villa often appears in several listings. Counting each property once moves the all-asks medians by 10M IDR or less in the larger areas (Canggu 350M, Seseh 320M, Umalas & Kerobokan unchanged) and by up to 22M in the thin ones.
See also our related analysis: Bali Rental Market Snapshot: September 2026, Bali 2-Bedroom Villa Price Distribution: Where is the Sweet Spot? and Bali Villa Rents by Bedroom Count 2026